1. Objective
The CV pipeline consistently over-estimates finger diameter compared to caliper ground truth. This study:
- Quantifies the systematic bias using a controlled dataset
- Validates pipeline stability (card detection, repeatability)
- Builds a linear regression calibration model
- Cross-validates to ensure generalization
2. Dataset
Collection Protocol
- Subjects: 10 people (6 female, 4 male)
- Fingers: 3 per person (index, middle, ring) → 30 unique finger measurements
- Photos: 2 per person (shot A and B) → 20 images total, 60 CV measurements
- Camera: iPhone, mounted on tripod at fixed height
- Lighting: Flash on (eliminates finger shadow)
- Surface: White paper (high contrast for edge detection)
- Reference: Standard credit card (ISO 7810 ID-1: 85.60mm × 53.98mm)
Ground Truth
- Diameter: Measured with digital caliper at ring-wearing zone (0.01mm precision)
- Circumference: Measured with soft tape at same zone
- Ring size: Best-fit ring determined by trial
Diameter Range
- Minimum: 1.49 cm (S08, ring finger)
- Maximum: 2.10 cm (S01, index finger)
- Mean: 1.80 cm
3. Card Detection Stability
All images were taken from a fixed tripod with the same card. The detected scale factor (px/cm) should be nearly identical.
| Metric | Value |
|---|---|
| Mean px/cm | 128.48 |
| Std dev | 0.57 |
| CV% | 0.44% |
| Range | 127.28 – 129.51 |
| Max spread | 2.23 px/cm (1.74%) |
Verdict: Card detection is highly stable. The ±0.44% variation is negligible (contributes < 0.01 cm to measurement uncertainty).
4. A vs B Repeatability
Each person was photographed twice (shots A and B). Comparing the same person×finger across the two shots quantifies pipeline noise independent of the person.
| Metric | Value |
|---|---|
| Mean |A−B| | 0.028 cm |
| Std |A−B| | 0.028 cm |
| Max |A−B| | 0.127 cm |
| 95th percentile | 0.074 cm |
Verdict: The pipeline is highly reproducible. Mean shot-to-shot variation of 0.028 cm is well below the systematic bias of 0.158 cm, confirming the over-measurement is a consistent bias, not random noise.
5. Ground Truth Consistency
Cross-checking caliper diameter (D) against tape circumference (C): for a perfect circle, C = πD. Deviations indicate finger cross-section ovality.
| Metric | Value |
|---|---|
| Mean (C − πD) | +0.228 cm |
| Range | −0.19 to +0.92 cm |
Fingers are not perfect circles — they are slightly oval, so circumference exceeds πD. This is expected and does not indicate measurement error. Some large outliers (S02: +0.91 cm) suggest either measurement imprecision with the tape or particularly oval finger cross-sections.
6. Raw Accuracy (Before Calibration)
| Metric | Value |
|---|---|
| N | 60 |
| Mean error (CV − GT) | +0.158 cm |
| Median error | +0.138 cm |
| Std of error | 0.078 cm |
| Mean % error | +8.8% |
| MAE | 0.158 cm |
| Max absolute error | 0.347 cm |
| RMSE | 0.176 cm |
| Pearson r | 0.883 |
| R² | 0.779 |
Key observation: All 60 measurements over-estimate (only 1 near zero at −0.008 cm). This is a systematic bias, ideal for linear correction.
7. Linear Regression Calibration
Model
actual_diameter = 0.7921 × measured_diameter + 0.2503
Equivalently: the pipeline over-measures by roughly 20%, and the regression corrects both the slope and offset.
After Calibration (In-Sample)
| Metric | Before | After | Improvement |
|---|---|---|---|
| MAE | 0.158 cm | 0.057 cm | 64% ↓ |
| RMSE | 0.176 cm | 0.070 cm | 60% ↓ |
| Max error | 0.347 cm | 0.174 cm | 50% ↓ |
| Mean error | +0.158 cm | ~0.000 cm | — |
Calibration Plots
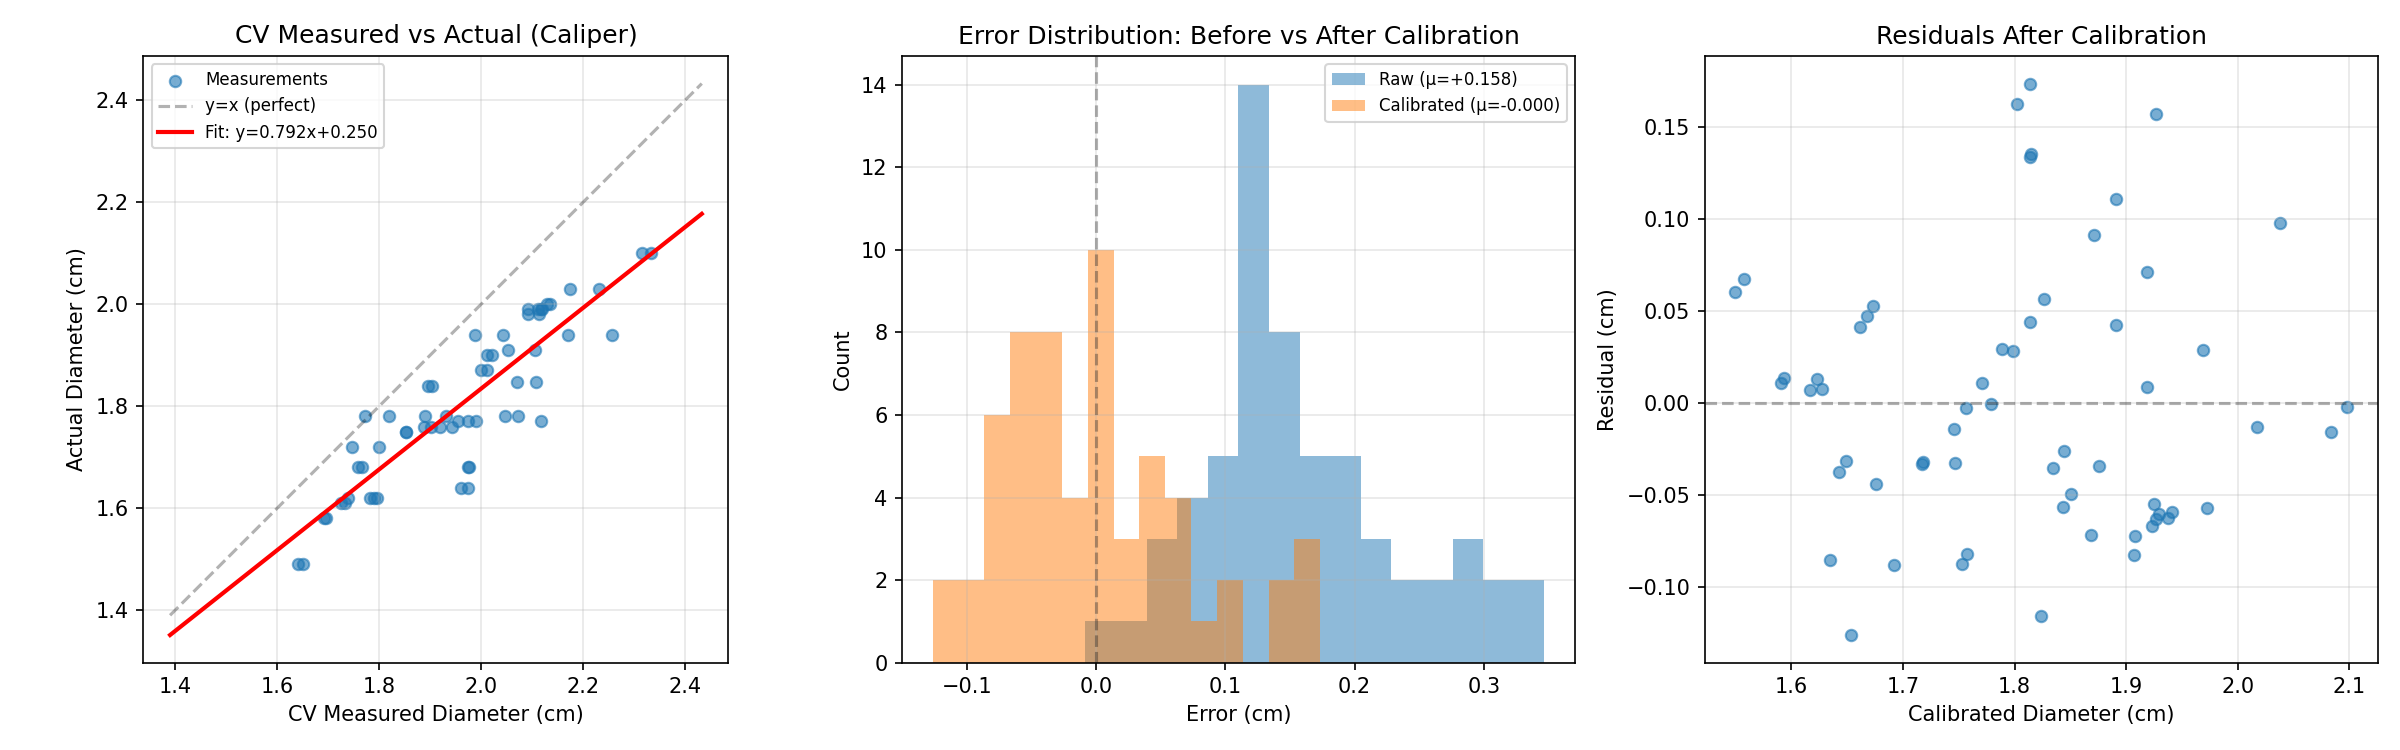 Left: CV measured vs actual diameter with regression line. Center: Error distribution before (blue) and after (orange) calibration. Right: Residuals after calibration — no strong pattern, confirming linear model is appropriate.
8. Cross-Validation (Leave-One-Person-Out)
To estimate real-world performance on unseen subjects, we perform 10-fold cross-validation where each fold holds out all 6 measurements from one person.
| Holdout Person | N | Slope | Intercept | Raw MAE | Cal MAE | Cal Max |
|---|---|---|---|---|---|---|
| S01 | 6 | 0.8046 | +0.2268 | 0.223 | 0.035 | 0.103 |
| S02 | 6 | 0.8189 | +0.2087 | 0.271 | 0.111 | 0.146 |
| S03 | 6 | 0.7824 | +0.2711 | 0.131 | 0.037 | 0.056 |
| S04 | 6 | 0.7726 | +0.2805 | 0.103 | 0.080 | 0.094 |
| S05 | 6 | 0.7916 | +0.2505 | 0.171 | 0.078 | 0.156 |
| S06 | 6 | 0.8149 | +0.2029 | 0.112 | 0.050 | 0.133 |
| S07 | 6 | 0.8120 | +0.2077 | 0.106 | 0.036 | 0.094 |
| S08 | 6 | 0.7591 | +0.3175 | 0.124 | 0.042 | 0.080 |
| S09 | 6 | 0.7793 | +0.2781 | 0.198 | 0.087 | 0.176 |
| S10 | 6 | 0.7845 | +0.2620 | 0.138 | 0.045 | 0.119 |
Cross-Validated Summary
| Metric | Raw | Calibrated | Improvement |
|---|---|---|---|
| MAE | 0.158 cm | 0.060 cm | 62% ↓ |
| RMSE | 0.176 cm | 0.075 cm | 57% ↓ |
Verdict: The calibration generalizes well. Worst-case holdout (S02) has Cal MAE = 0.111 cm, still a large improvement from Raw MAE = 0.271 cm. Regression coefficients are stable across folds (slope 0.759–0.819), indicating the model is robust.
9. Regression Coefficient Stability
Across the 10 CV folds:
- Slope range: 0.759 – 0.819 (mean 0.792)
- Intercept range: 0.207 – 0.318 (mean 0.250)
The narrow range confirms that no single person dominates the fit — the calibration is dataset-stable.
10. Limitations & Future Work
- Sample size: 10 subjects (60 measurements) is adequate for a linear model but small for detecting non-linear patterns. More data could improve robustness.
- Demographic coverage: All subjects are Chinese adults. Calibration may need re-fitting for significantly different hand morphologies.
- Setup dependency: Calibration was derived from tripod + flash images. Handheld or variable-lighting conditions may introduce additional bias.
- Single camera: All images from one iPhone model. Different cameras/lenses may shift the bias.
- Outliers: S09 and S05 ring fingers show ~20% raw error, possibly due to knuckle prominence or finger positioning. These are the hardest cases even after calibration.
11. Conclusion
The regression calibration reduces measurement error by 62% (MAE: 0.158 → 0.060 cm) and generalizes well across subjects in leave-one-person-out cross-validation.
Final calibration model:
actual_diameter = 0.7921 × measured_diameter + 0.2503
Stored in src/calibration.json and applied automatically (bypass with --no-calibration).