This is an analysis of what an overnight RMSSD number is actually made of. Median sleep RMSSD in this corpus ranges from 22.9 to 112.8 ms across eleven independent nights of one wearer — almost a fivefold spread within one person, which is too large to accept as a generic “readiness” score without asking what changed underneath it.
The answer turns out to be narrow and mostly arithmetic. High sleep HRV is a deep respiratory swing in the heart period; low sleep HRV is a shallow one. Breathing rate barely moves; the depth of the modulation moves several-fold. Once that modulation is made explicit, most of the behaviour of RMSSD — including its tight relationship with sleeping heart rate — falls out of a single two-parameter expression.
1. Scope & method
Question: given a nightly RMSSD, what physical quantity varies when that number varies?
Corpus: eleven independent overnight recordings of one wearer, from the ring’s raw optical channel, in two batches six weeks apart.
Pipeline. Each PPG-on window is band-pass filtered, systolic peaks are detected, and
the beat-interval series is cleaned with physiologic and local-median guards. A window is
accepted only when the beat-derived heart rate agrees with the spectral heart rate on the
same window. The accepted series is then split by frequency, and the 0.15–0.40 Hz component
is fitted as a single sinusoid to recover its amplitude A and its frequency.
Sample: 680 QC-passed windows, roughly 85 s each.
| Night | Batch | Windows | Median RMSSD | Median A | Median HR | Breaths/min |
|---|---|---|---|---|---|---|
| sleep2 | may | 100 | 22.9 ms | 18.6 ms | 63.0 bpm | 14.5 |
| sleep3 | may | 57 | 92.7 ms | 79.8 ms | 51.2 bpm | 14.8 |
| sleep5 | may | 84 | 90.9 ms | 76.3 ms | 51.5 bpm | 15.1 |
| sleep7 | may | 66 | 112.8 ms | 92.3 ms | 50.0 bpm | 15.4 |
| sleep8 | may | 87 | 74.5 ms | 62.3 ms | 54.5 bpm | 15.1 |
| sleep9 | jul | 64 | 83.4 ms | 70.5 ms | 52.2 bpm | 15.6 |
| sleep10 | jul | 31 | 66.7 ms | 55.3 ms | 55.6 bpm | 15.6 |
| sleep11 | jul | 42 | 94.0 ms | 75.7 ms | 51.9 bpm | 14.6 |
| sleep12 | jul | 52 | 107.2 ms | 88.2 ms | 49.4 bpm | 15.0 |
| sleep13 | jul | 47 | 69.4 ms | 60.1 ms | 54.1 bpm | 15.5 |
| sleep16 | jul | 50 | 101.4 ms | 84.4 ms | 50.4 bpm | 14.5 |
Out of scope. There is no respiratory belt, no ECG and no PSG. “Respiratory” here means a coherent oscillation in the standard 0.15–0.40 Hz band — an inference from frequency location, never a measurement. The May batch was recorded six weeks before the July batch, and the account below was built on May alone; July is a genuine holdout.
2. Start with the signal, not the score
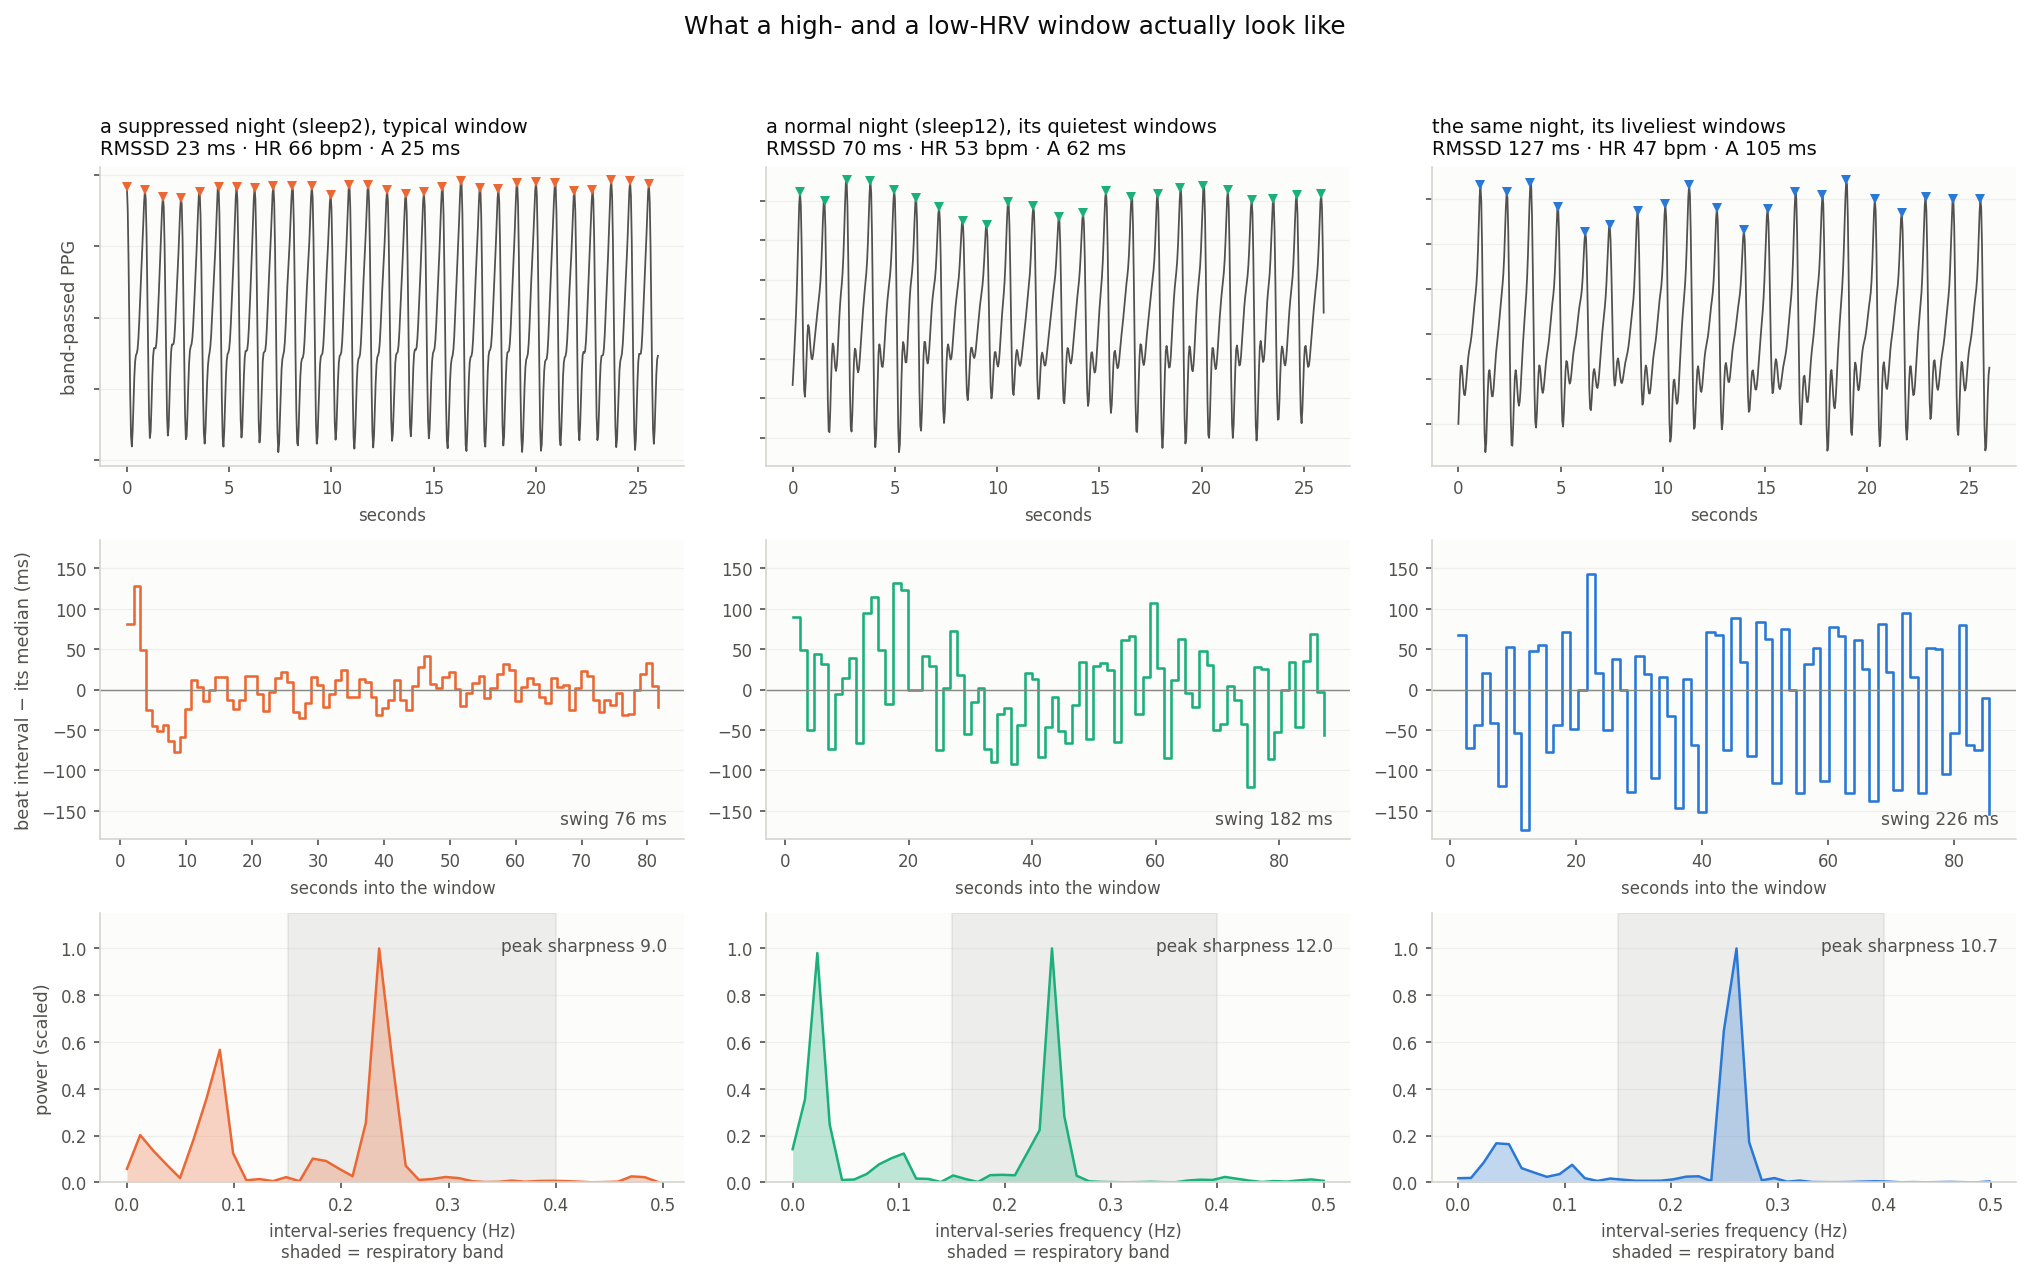
Three windows from the raw PPG pipeline. Top row: the optical pulse with its detected beats. Middle: the beat-interval series after subtracting its own median. Bottom: the spectrum of that series.
The low-HRV window is not a bad signal. The left window comes from the lowest-HRV night. The pulse is clean and every beat is easy to identify — this is not noise or weak perfusion. The intervals simply move very little: RMSSD 23 ms, fitted respiratory amplitude ≈ 25 ms.
The high-HRV windows differ in amplitude, not period. The middle and right windows come from the same higher-HRV night, several hours apart. Their intervals visibly oscillate, rising and falling roughly once every four beats. The period barely changes between them; the amplitude does — the respiratory swing grows from 62 to 105 ms, and RMSSD grows with it from 70 to 127 ms.
Why RMSSD in particular responds to this. HRV is often described as the overall spread of the heartbeat. RMSSD is more specific: it measures the size of the step from one interval to the next. A series can wander over a wide range in small, smooth steps and still score low. A respiratory oscillation makes adjacent intervals alternate sharply, and scores high.
This is also why RMSSD can exceed SDNN here without anything being wrong. SDNN measures the dispersion of the intervals; RMSSD measures the size of consecutive steps. At three or four beats per breath, adjacent beats land on very different phases of the respiratory wave, so the step can exceed the series’ own standard deviation.
3. RMSSD is a respiratory-wave measurement by construction
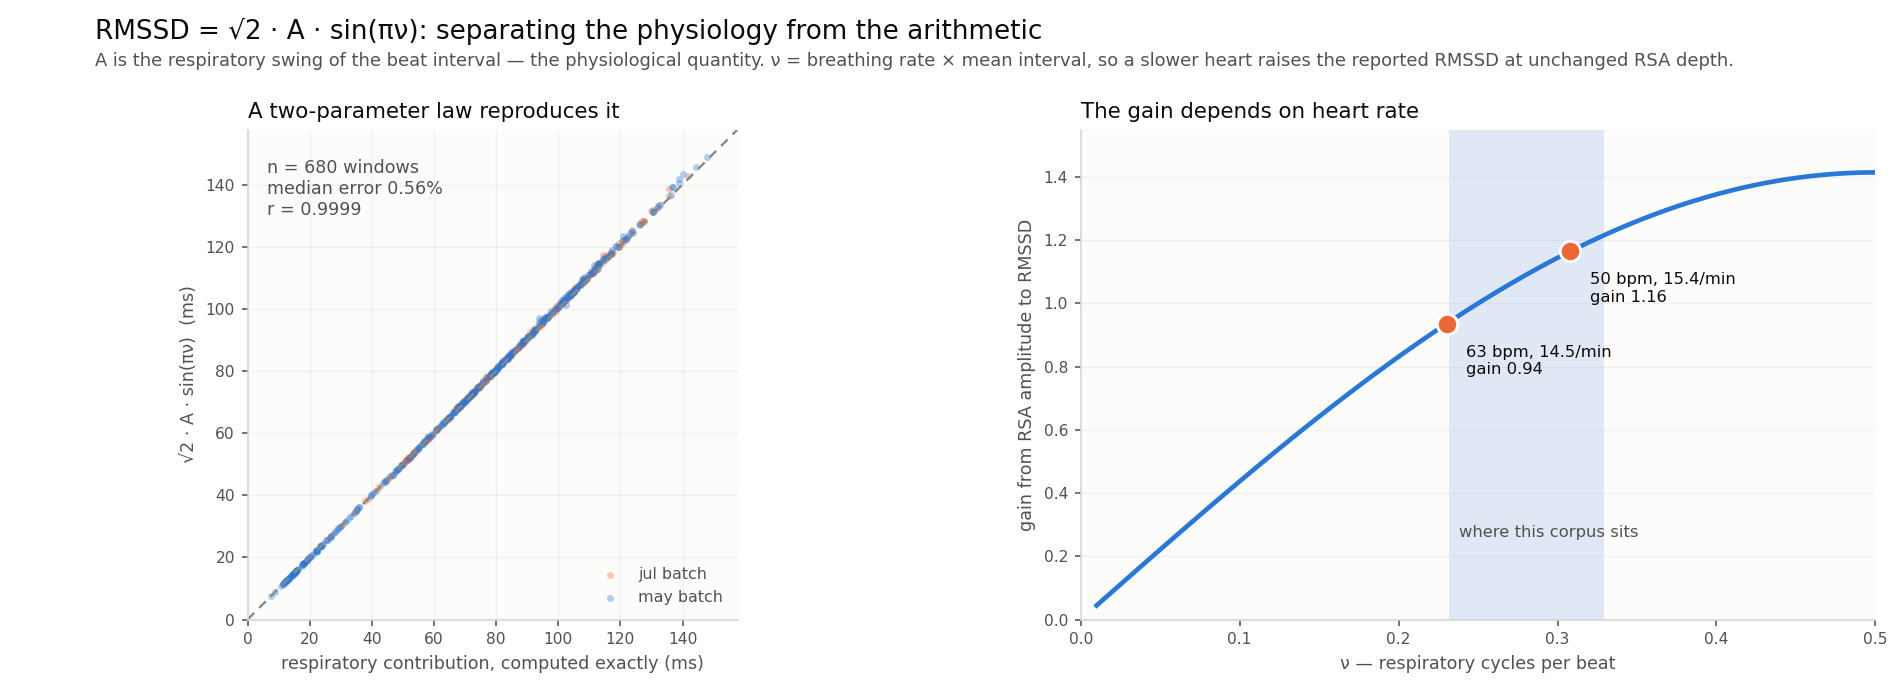
For an interval series carrying a respiratory oscillation,
IBI[n] = T + A · sin(2πνn + φ)
where T is the mean beat interval, A the respiratory sinus arrhythmia amplitude, and
ν the number of respiratory cycles per beat. RMSSD differences successive intervals, and
differencing that sinusoid gives exactly
RMSSD_resp = √2 · A · sin(πν), ν = breathing frequency × mean beat interval
The expression separates two things raw RMSSD mixes together:
A— the depth of the respiratory modulation. The physiologically interesting part: how many milliseconds each breath swings the heart period.√2·sin(πν)— the gain introduced by the metric. It depends on how the heart samples the respiratory wave, and therefore on heart rate, even when the underlying modulation does not change.
How much of RMSSD this covers. Across the eleven nights the respiratory component is a median 93.5 % of RMSSD, with a range of 79.9–97.2 %. On that component, the two-parameter expression matches the exact frequency-domain calculation with a median error of 0.56 % (p90 1.20 %, r = 0.9999) over the 680 windows.
That near-perfect match is a re-expression, not an independent validation — both sides are derived from the same beat-interval series. What it establishes is that the band term is well described by a single sinusoid, so the two-parameter reduction loses essentially nothing. The physics is in the derivation, not the scatter plot.
What varies is depth, not rate. Breathing frequency is near-constant across nights at
14.5–15.6 breaths per minute. A ranges from 18.6 to 92.3 ms. The nights differ in how
deeply the wearer breathed into the heart period, not in how quickly.
It holds out of sample. The account was built on the May recordings; July arrived six weeks later and was never seen while it was built. Split by batch, the law’s median error is 0.53 % on 394 May windows and 0.58 % on 286 July windows. The night-level medians track too: May and July have median RMSSD of 90.9 and 88.7 ms, RSA amplitude of 76.3 and 73.1 ms, sleeping heart rate of 51.5 and 52.1 bpm, and breathing rate of 15.1 and 15.3 breaths per minute. The later batch reproduces the same signal geometry.
4. Separating the physiology from the arithmetic
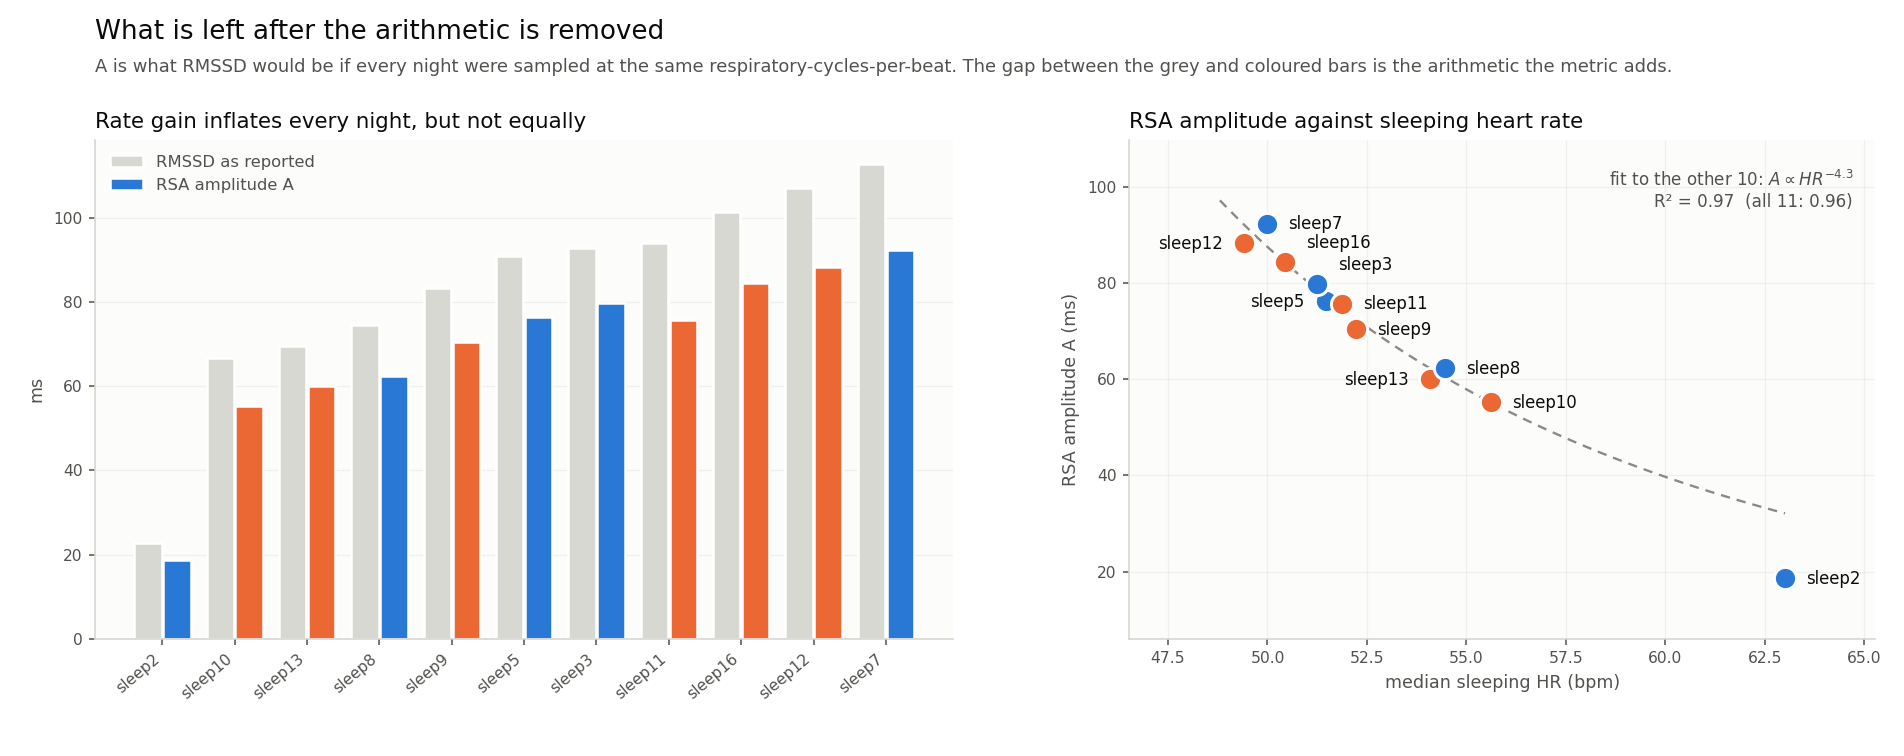
The grey bars on the left are RMSSD as reported. The coloured bars are A — what remains
after the rate-dependent gain is removed, i.e. what RMSSD would be if every night were
sampled at the same respiratory-cycles-per-beat.
The correction is not cosmetic. At 63 bpm and 14.5 breaths per minute the gain from A
to respiratory RMSSD is 0.94. At 50 bpm and 15.4 breaths per minute it is 1.16. Two windows
with identical breathing and identical RSA depth can therefore report RMSSD values 24 %
apart purely because one heart is beating more slowly.
But most of the spread is real. Taking the highest and lowest nights, the respiratory
contribution differs by 6.0×, decomposing into roughly 4.96× from RSA amplitude and 1.21×
from the metric’s heart-rate gain. Across all eleven nights, A accounts for about 81 %
of the between-night log-variance in the respiratory contribution. The rate gain alone
accounts for about 1 %; the remaining 18 % is covariance, because slower hearts also tend to
have deeper RSA.
So the night-to-night differences are not a unit artefact — most of the signal survives removing the arithmetic. But raw RMSSD does systematically amplify exactly those nights that already had slower heart rates and deeper respiratory modulation.
Verdict — A is the more interpretable of the two. It stays in milliseconds, but it
answers a cleaner question: how deeply is breathing modulating the heart period? RMSSD
answers that same question after mixing in the sampling geometry of the heartbeat.
5. Sleeping heart rate and HRV are highly correlated
The right panel above carries the most uncomfortable result in the analysis.
Across the eleven nights, median sleeping heart rate explains 95.6 % of the variance in
A on a log-log scale, rising to 96.9 % when the one unusually low-RSA night is excluded.
The May and July batches, considered separately, each rank their nights in exactly opposite
order by sleeping heart rate and by RMSSD: the slowest-heart night has the highest HRV, the
fastest-heart night the lowest.
This is not mechanical determination. The between-night relationship is much stronger
than the within-night one — night-centred heart rate explains only about 44 % of the
window-level variation in A. A night can have a different autonomic set point, not just a
different collection of instantaneous heart rates.
But as a practical reading of these data, the redundancy is hard to avoid. Median sleeping heart rate and median RMSSD are not two independent pieces of evidence about the night. Reporting both as separate green lights gives the impression of corroboration while largely counting the same physiological axis twice: one number describes how slowly the heart ran, the other mostly describes how deeply respiration modulated that slower heart — with an extra mathematical gain that also rises as heart rate falls.
The redundancy is strongest at the level of whole-night medians. HRV can still add structure heart rate alone does not carry — whether interval variation is coherently locked to respiration, whether a window is distorted by a single bad beat, whether an unusual night departs from that person’s own heart-rate–RSA relationship. But the raw nightly level is mostly not new evidence.
6. How to read and report a sleep HRV number
The common interpretation — higher is better, lower means worse recovery — compresses too much into one phrase. The signal supports something narrower and more useful:
Higher RMSSD usually means respiration is producing a deeper beat-to-beat swing, measured on a heart that is often also beating more slowly.
Four consequences for how an overnight HRV summary should be built:
- Report
Aalongside or instead of raw RMSSD. It removes the rate-dependent gain while preserving the part of the signal responsible for most of the night-to-night variation. - Do not present median sleeping HR and median RMSSD as two votes for one conclusion. Both are useful measurements; their shared information should be made explicit rather than double-counted into a composite score.
- Treat within-person change as the unit, and respect its precision. Even within the same night, separate recordings differ by as much as roughly 10 % in RMSSD, while heart rate is considerably more repeatable. A precise-looking number is still an estimate of a moving physiological signal.
- Keep the mechanism visible. A nightly score hides whether its value came from a coherent respiratory wave, a few extreme beat differences, or content at other timescales. The interval series and its respiratory amplitude tell a more informative story than RMSSD alone.
Sleep HRV is not meaningless — in these recordings it is remarkably structured. But the structure is more specific than “recovery”: it is a respiratory wave in the heart period, coupled tightly to sleeping heart rate, and transformed by the mathematics of the metric used to summarise it.
Appendix — at a glance
| Quantity | Across 11 nights | Role |
|---|---|---|
| Median RMSSD | 22.9 – 112.8 ms | what gets reported |
RSA amplitude A | 18.6 – 92.3 ms | the physiology; ~81 % of the spread |
Rate gain √2·sin(πν) | 0.98 – 1.18 | the arithmetic; ~1 % of the spread |
| Breathing rate | 14.5 – 15.6 /min | near-constant; explains nothing |
| Median sleeping HR | 49.4 – 63.0 bpm | explains 95.6 % of log A |
| Respiratory share of RMSSD | median 93.5 % | what the metric is mostly measuring |