From waveform to interval
An ECG trace is the PQRST complex, named for the labelling convention introduced by the Dutch physiologist Willem Einthoven. Of its five features, the QRS complex is by far the most distinct — a sharp, high-amplitude spike that survives noise and motion far better than the low, rounded P and T waves. So detection algorithms ignore most of the waveform and locate one thing: the R peak.
What comes out is a series of timestamps, and the distances between consecutive timestamps form the inter-beat interval series. That series — a list of numbers in milliseconds — is the raw material for every HRV metric that exists. The waveform is scaffolding. Once you have the intervals, you throw it away.
This is also why HRV is tractable on a device with no electrodes at all. A ring or a watch measures blood volume optically rather than electrically, but if it can find pulse peaks reliably, it lands in the same interval series and the same downstream math applies.
Time domain and frequency domain
From the interval series, two families of metrics branch off.
Time-domain metrics are computed directly on the intervals. SDNN is the standard deviation of the normal-to-normal intervals — overall variability, everything mixed together. RMSSD is the root mean square of successive differences, and because it looks at beat-to-beat change rather than spread, it weights fast fluctuation heavily. That makes RMSSD a close proxy for the high-frequency band without ever running a transform.
Frequency-domain metrics require converting the interval series to a spectrum, typically by FFT, and then splitting it into bands. Below 0.04 Hz is very low frequency. From 0.04 to 0.15 Hz is low frequency. From 0.15 to 0.4 Hz is high frequency. For each band you can report a peak frequency and a power — the integral under that section of the spectrum. In practice the two most commonly reported figures are ln(HF power), log-transformed because the raw values are heavily skewed, and the LF/HF ratio.
There is a practical asymmetry between the two families worth knowing if you are building anything on top of this. Time-domain metrics are considerably more tolerant of bad beats. Within a 60-second window you can typically discard 10–20% of the intervals as artifacts and still get a usable SDNN or RMSSD. Frequency-domain analysis is far less forgiving, because deleting samples from a series you are about to transform distorts the spectrum itself. On a wrist or a finger, where motion artifacts are constant, that difference matters more than the theoretical elegance of band separation.
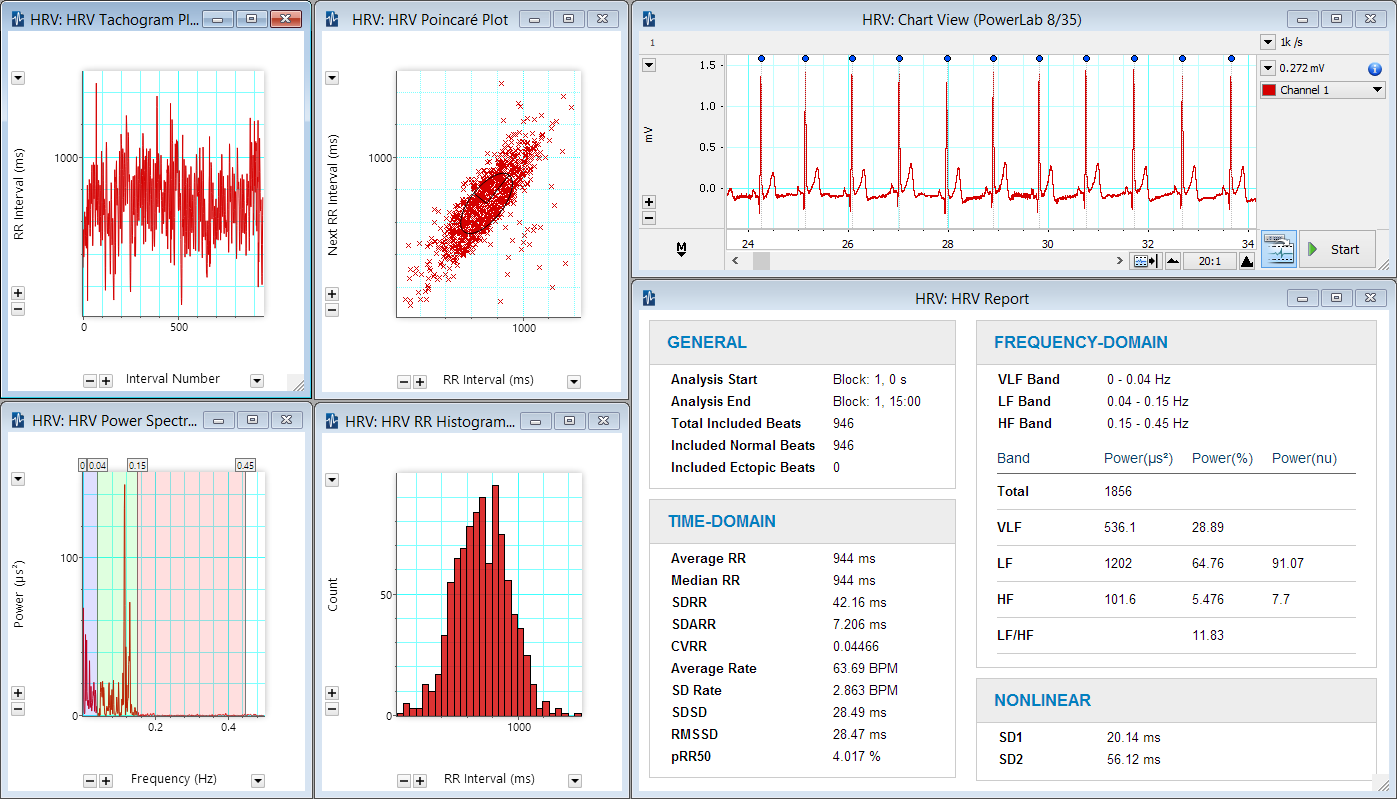 HRV Analysis Software from ADInstruments
What psychology experiments actually read
HRV appears constantly in psychology research for a reason that has little to do with cardiology: it is a non-invasive, objective, continuously recordable index of autonomic activity. It lets you put a number on emotional state, stress load, and regulatory capacity without asking the participant anything.
Which metric a study leans on depends on what it is trying to observe:
- Emotional recovery, empathy, relaxation training, felt safety — the high-frequency band. These are all parasympathetic-engagement questions, and HF is the clean channel for them.
- Acute stress, conflict, competition, emotional suppression — low frequency and the LF/HF ratio. These are slow-acting, sustained-load conditions, which is exactly the timescale the low-frequency band captures.
- Chronic anxiety, long-term psychological depletion, major depression — very low frequency added to the above. Sustained states leave their mark at the slowest end of the spectrum.
A classic representative work is Gross & John at Stanford University, “Individual Differences in Two Emotion Regulation Processes: Implications for Affect, Relationships, and Well-Being”, a study of reappraisal versus suppression where the physiological cost of suppression is precisely the kind of sustained load that shows up in the low-frequency range.
Acting on the signal
Knowing which band reflects what suggests where the levers actually are.
Breathing is the fastest one, and it is fast for the mechanistic reason above. Deliberate deep breathing, especially with a lengthened exhale, drives up the high-frequency component directly, because the vagal brake responds within hundreds of milliseconds. The practical value is less about the number going up and more about buying time — it is a way to stop the loss before making a poor decision in an unstable state.
Metabolic clearance operates on a slower clock. The adrenaline and cortisol released during a stress response have their own elimination cycles, and you cannot reason them away. What you can do is accelerate fluid turnover: sweat through aerobic exercise, saliva through eating, urine through drinking water. This is a blunt lever, but it is a real one.
Cognitive intervention works on the input rather than the output — reducing how readily something registers as a threat in the first place, by holding a more objective and more plural view of the outside world, including the source of the stimulus.
The first lever moves in minutes, the last in months. HRV is one of the few signals that can see across that whole range — which is also why a single day’s reading tells you much less than a baseline built over time.