Heart-rate variability (HRV) is the beat-to-beat fluctuation in the timing of the heartbeat, and it is one of the clearest windows we have into how the body recovers overnight. When the parasympathetic (“rest and digest”) branch of the nervous system takes over during sleep, HRV tends to rise and heart rate falls. This report looks at what that recovery signal actually looks like across eight nights of sleep recorded by a photoplethysmography (PPG) ring.
The dataset is eight overnight recordings (sleep1–sleep8) plus one short nap. The
core metric is RMSSD (the root mean square of successive beat-to-beat differences,
the most robust short-window HRV measure), computed from quality-controlled PPG beat
intervals. SDNN (the standard deviation of beat intervals) and sleeping heart rate
(HR) serve as supporting signals.
Method
Each PPG-on window is band-pass filtered, systolic peaks are detected, and the inter-beat intervals are cleaned with physiologic and local-median guards. A window is accepted only when the beat-derived heart rate agrees with the heart rate estimated from the signal’s frequency spectrum. This cross-check avoids using windows where PPG peak detection likely locked onto noise or the dicrotic notch rather than the true heartbeat.
Some important caveats frame everything below:
- These are ultra-short HRV windows, not the 5-minute segments used in clinical HRV. RMSSD is the most defensible metric at this timescale; the LF/HF frequency-domain ratio is intentionally not used.
- PPG on this device is duty-cycled — the sensor samples in short bursts rather than running continuously — so HRV is measured intermittently across the night.
- The data appears to come from one person across multiple nights. The strongest conclusions are within-person and night-to-night, not population norms.
- This is wellness-oriented signal analysis, not medical interpretation.
Dataset Quality
Across the eight overnight recordings there are 576 QC-passed sleep HRV windows — enough to compare nights and within-night trends, though not every night has the same amount of accepted data.
| Night | Accepted windows | Approx HRV minutes | Median RMSSD | Median SDNN | Median HR |
|---|---|---|---|---|---|
| sleep1 | 98 | 142.1 | 26.2 ms | 46.3 ms | 56.9 bpm |
| sleep2 | 100 | 145.0 | 22.9 ms | 33.3 ms | 63.0 bpm |
| sleep3 | 57 | 82.6 | 92.7 ms | 77.0 ms | 51.2 bpm |
| sleep4 | 36 | 52.2 | 102.0 ms | 77.8 ms | 50.7 bpm |
| sleep5 | 84 | 121.8 | 90.9 ms | 74.6 ms | 51.5 bpm |
| sleep6 | 48 | 69.6 | 108.9 ms | 84.8 ms | 50.4 bpm |
| sleep7 | 66 | 95.7 | 112.8 ms | 83.3 ms | 50.0 bpm |
| sleep8 | 87 | 126.1 | 74.5 ms | 61.6 ms | 54.5 bpm |
The cohort median across all accepted overnight windows is RMSSD 77.7 ms, SDNN 64.6 ms, and HR 54.0 bpm.
Night-to-Night Pattern
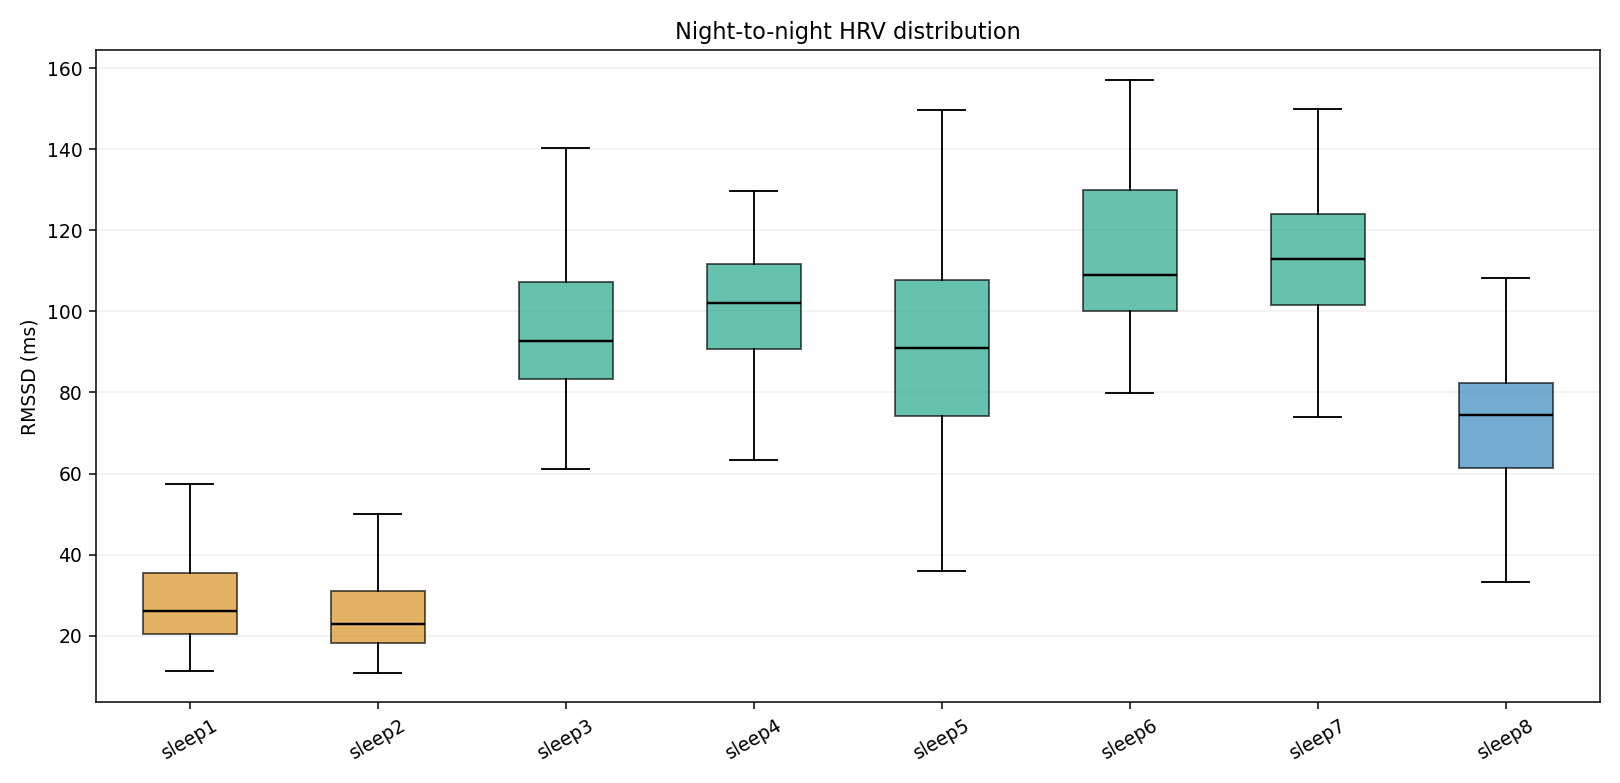
The biggest finding is a clear split between two low-HRV nights and six moderate-to-high HRV nights:
- sleep1 and sleep2 are low-recovery outliers: RMSSD medians of 26.2 ms and 22.9 ms. sleep2 also has the highest median sleeping HR at 63.0 bpm.
- sleep3 through sleep7 are the strongest nights: RMSSD medians range from 90.9 to 112.8 ms, with median HR near 50-52 bpm.
- sleep8 is intermediate: RMSSD 74.5 ms and HR 54.5 bpm, still closer to the higher-HRV cluster than to sleep1/sleep2.
The range is large: median nightly RMSSD spans 22.9 to 112.8 ms, nearly a 5x difference. For a within-person dataset, that is a meaningful recovery-load signal rather than minor measurement noise.
HRV Over the Night
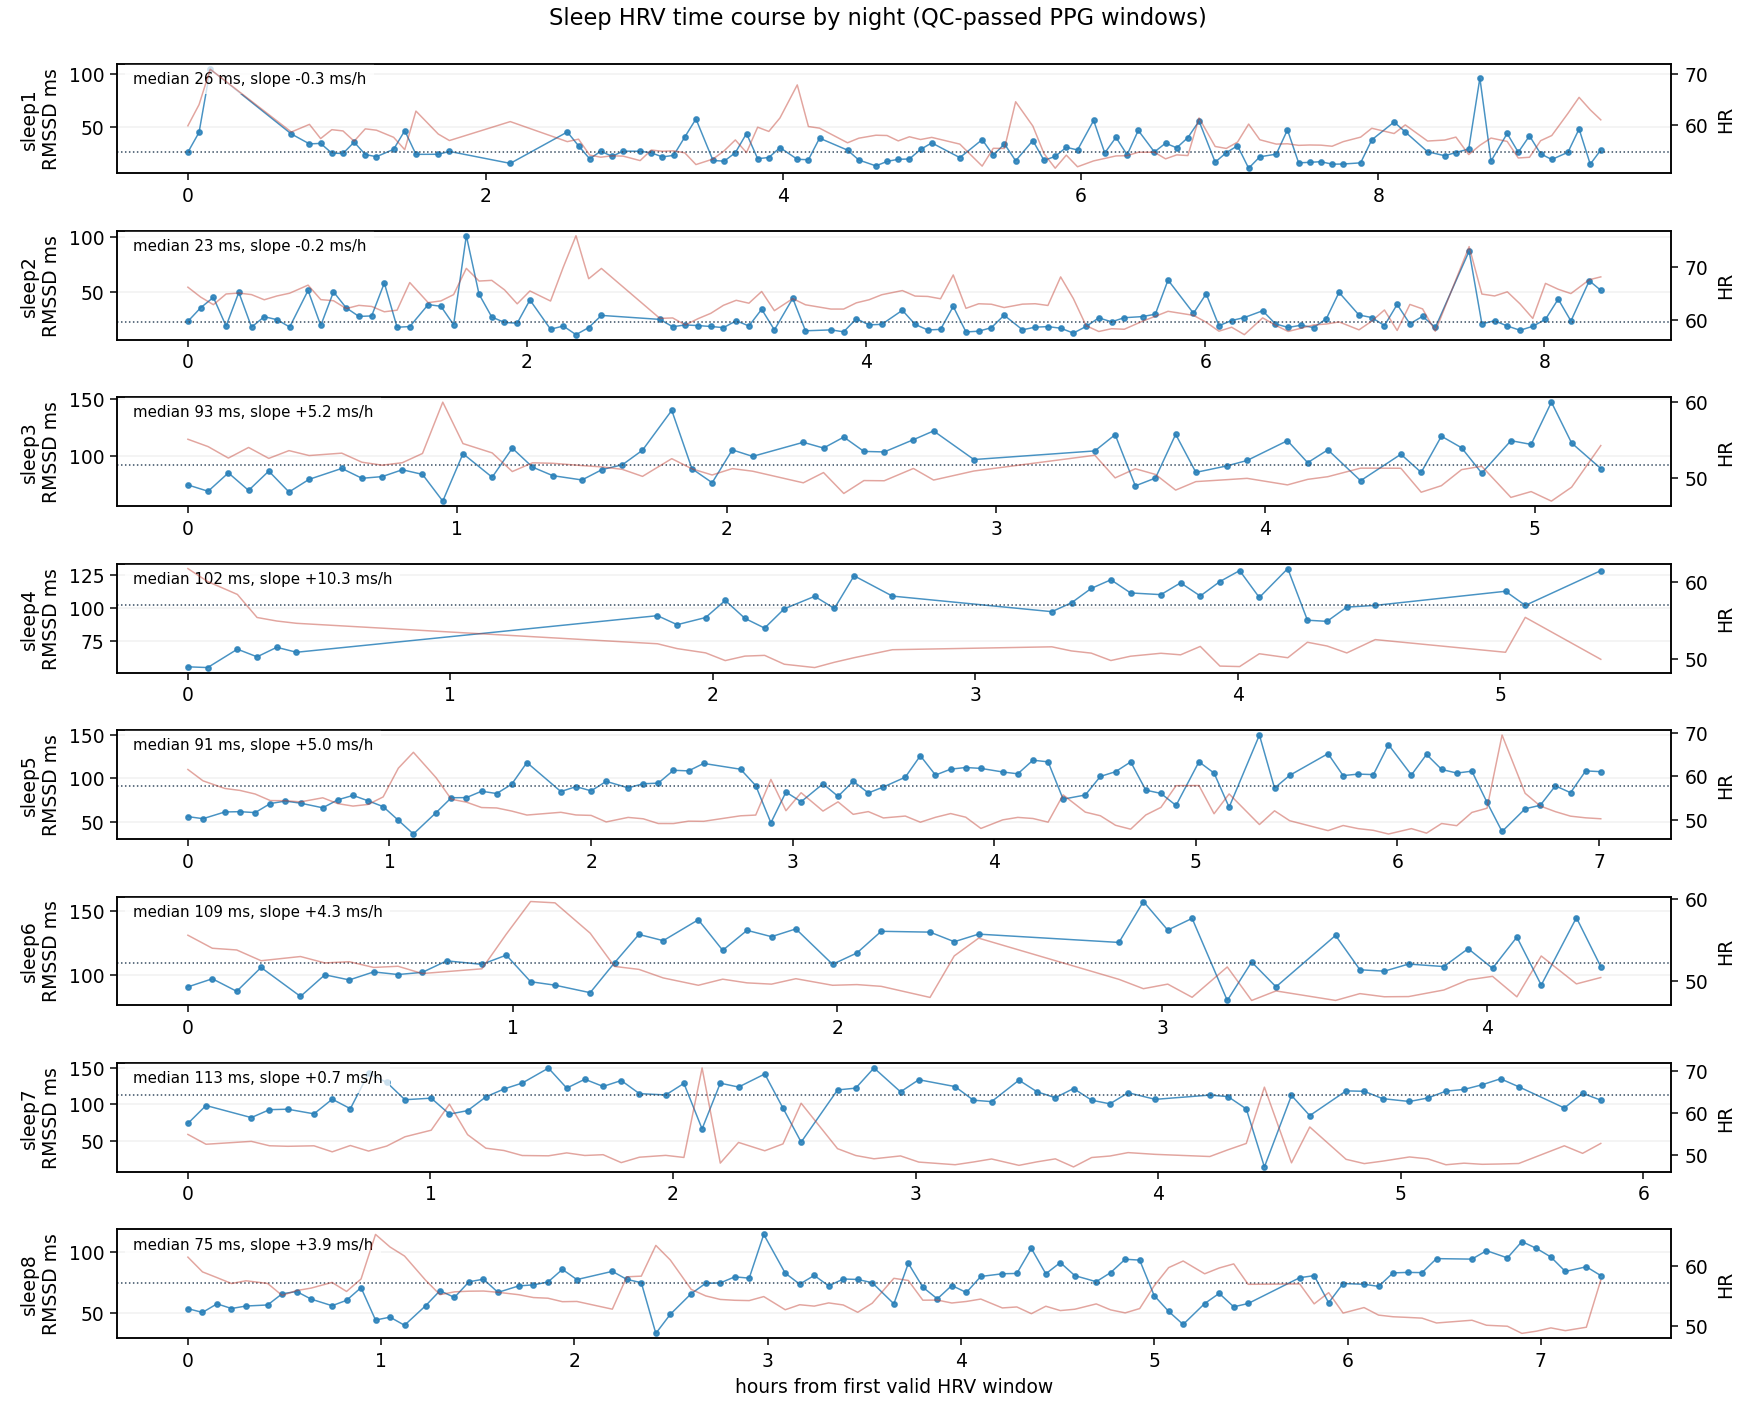
Most nights show the expected recovery-like direction: HRV rises and HR falls as the night progresses. The per-night RMSSD slopes are:
| Night | RMSSD slope | HR slope | Late - early RMSSD |
|---|---|---|---|
| sleep1 | -0.32 ms/h | -0.17 bpm/h | -0.9 ms |
| sleep2 | -0.19 ms/h | -0.41 bpm/h | -1.7 ms |
| sleep3 | +5.18 ms/h | -0.84 bpm/h | +15.4 ms |
| sleep4 | +10.30 ms/h | -1.18 bpm/h | +43.2 ms |
| sleep5 | +4.97 ms/h | -0.72 bpm/h | +28.8 ms |
| sleep6 | +4.32 ms/h | -1.17 bpm/h | +8.3 ms |
| sleep7 | +0.72 ms/h | -0.64 bpm/h | +2.9 ms |
| sleep8 | +3.91 ms/h | -0.89 bpm/h | +16.4 ms |
Interpretation:
- Six of eight nights have a positive RMSSD slope.
- Every night has a negative HR slope, meaning HR generally decreases overnight.
- sleep4 and sleep5 show the strongest autonomic recovery ramp: HRV climbs substantially from early to late sleep.
- sleep1 and sleep2 do not show a meaningful HRV recovery ramp; both stay low throughout the night.
Early, Middle, Late Sleep
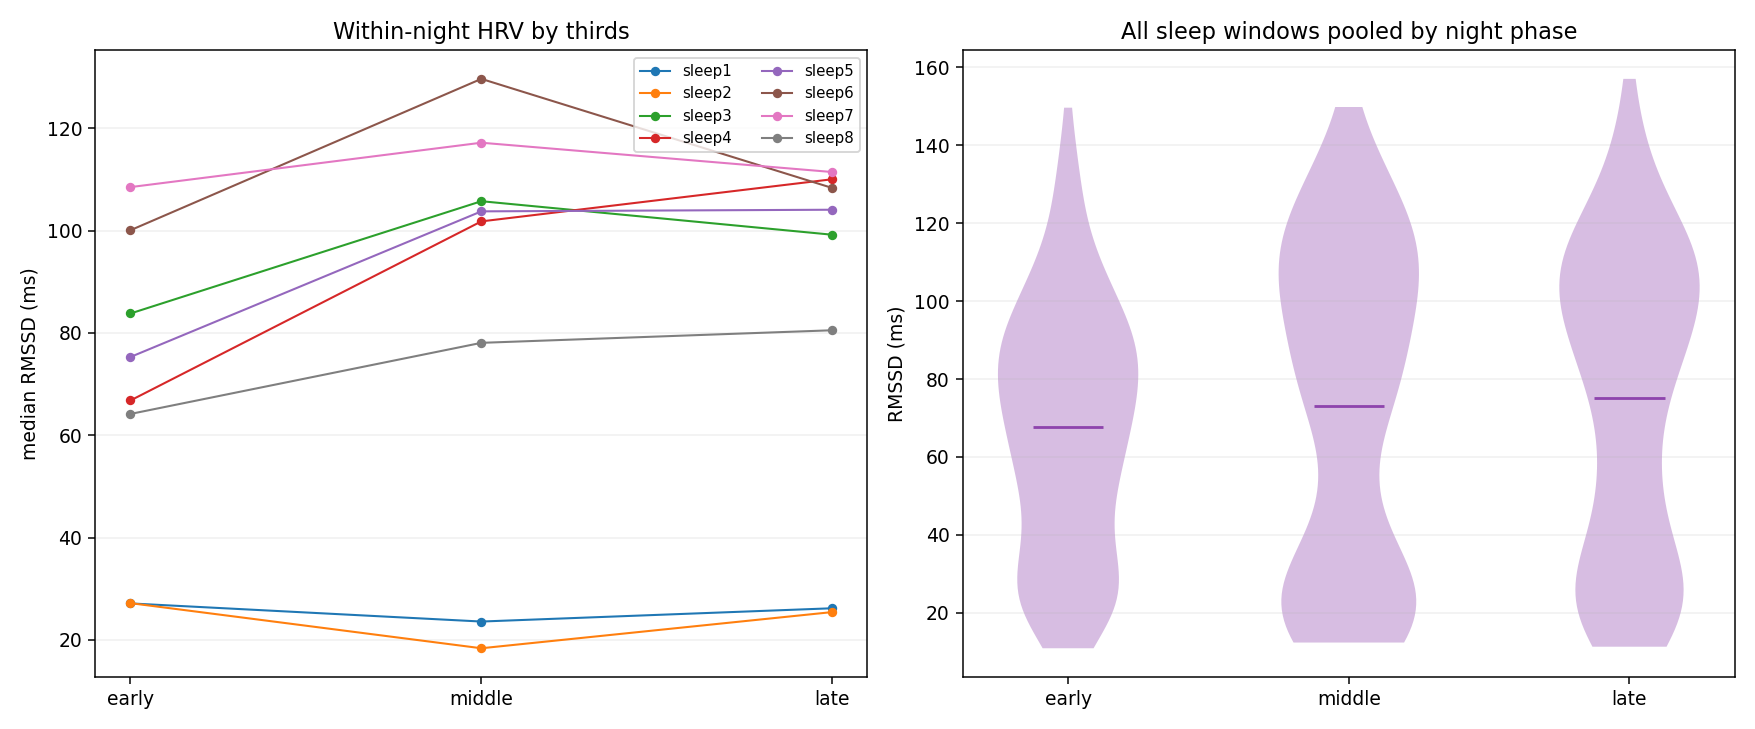
Pooled across all sleep nights (IQR is the interquartile range, the middle 50% of values):
| Phase | Windows | Median RMSSD | IQR | Median HR |
|---|---|---|---|---|
| Early | 186 | 70.5 ms | 40.6-90.6 ms | 55.3 bpm |
| Middle | 193 | 80.5 ms | 25.8-108.8 ms | 53.0 bpm |
| Late | 197 | 83.9 ms | 32.3-107.7 ms | 52.5 bpm |
The common shape is: lower HRV early, higher HRV later, lower HR later. The effect is not uniform because sleep1/sleep2 remain suppressed, and sleep7 starts high already, but the pooled direction is consistent with parasympathetic recovery accumulating across the night.
HR-HRV Coupling
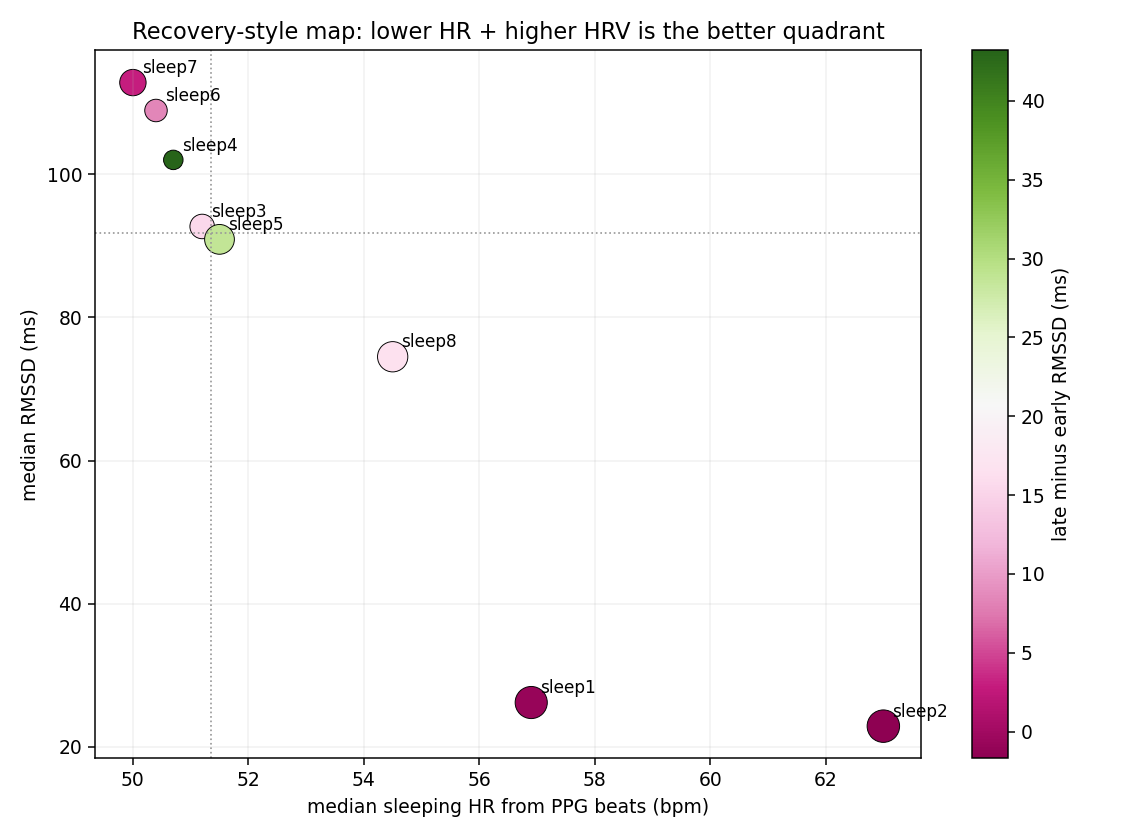
The strongest statistical relationship in the dataset is between sleeping HR and RMSSD. Across QC-passed overnight windows, the Spearman correlation is approximately -0.83: when HR is lower, RMSSD is usually higher.
That matters because it gives two independent-looking signals the same story:
- sleep6/sleep7: low HR around 50 bpm and the highest RMSSD.
- sleep3/sleep4/sleep5: low HR and high RMSSD.
- sleep8: moderate HR and moderate HRV.
- sleep1/sleep2: elevated HR and low RMSSD, especially sleep2.
For recovery interpretation, the favorable quadrant is lower HR + higher RMSSD. sleep6 and sleep7 are the clearest examples. sleep1 and sleep2 are the clearest low-recovery nights.
Common Patterns Across Nights
The recurring patterns are:
- Sleeping HR trends downward overnight. All eight overnight recordings have a negative HR slope.
- Higher-HRV nights cluster near lower HR. The low-HR nights are also the high-RMSSD nights.
- Late-night HRV is usually higher than early-night HRV. Six of eight nights have positive late-minus-early RMSSD.
- The high-HRV nights are not just isolated spikes. sleep3-sleep7 have elevated medians and broad distributions, meaning HRV is persistently higher.
Differences Between Nights
The main differences are:
- sleep1 and sleep2: suppressed HRV, weak or absent overnight HRV improvement, and higher HR. These look like poor-recovery nights in this dataset.
- sleep3 to sleep5: high HRV with meaningful overnight improvement. sleep4 has fewer accepted windows but the strongest positive slope.
- sleep6 and sleep7: best overall recovery profile. Both combine the lowest HR with the highest median RMSSD. sleep7 is especially stable: high HRV from early sleep onward.
- sleep8: middle profile. Better than sleep1/sleep2, but below sleep3-sleep7.
Practical Recovery Insights
For this subject and this sensor pipeline, the most useful sleep-recovery marker is not a single raw HRV point. It is the combination of:
- median overnight RMSSD,
- median sleeping HR,
- whether RMSSD rises from early to late sleep,
- and whether HR falls overnight.
By that combined view:
- Best recovery nights: sleep6, sleep7.
- Good recovery nights: sleep3, sleep4, sleep5.
- Moderate recovery night: sleep8.
- Low recovery nights: sleep1, sleep2.
The most actionable signal is the contrast between sleep1/sleep2 and the later nights. If these correspond to known behavior differences, the likely candidates to check are late meals, alcohol, illness, heavy training, stress, short sleep opportunity, late caffeine, or poor sleep timing. The data itself cannot identify which factor caused the suppression, but it clearly marks those nights as physiologically different.
Where This Goes Next
A few natural extensions would sharpen the recovery signal:
- Pair each night with daily context — alcohol, exercise load, caffeine, illness, stress, bedtime, and subjective recovery — to explain why nights differ.
- Compute a personal baseline: rolling median RMSSD and HR deviation from the subject’s own last 7-14 nights, rather than absolute thresholds.
- Keep RMSSD as the primary HRV metric for this duty-cycled PPG setup, and avoid LF/HF unless continuous, clean 5-minute PPG segments become available.
- Check whether low-HRV nights coincide with more movement, more awakenings, or shorter sleep duration.
The headline, though, is simple: even with intermittent, ultra-short PPG windows, the overnight HRV signal behaves the way physiology predicts — HRV climbs and heart rate settles as the body recovers — and it cleanly separates good-recovery nights from poor ones.